Tembo Hotel Analysis
From a dirty hotel spreadsheet to a Power BI board the Director can trust, with every headline tied to a SQL query.
Context
Tembo Hotel & Suites, a mid-range business hotel in Nairobi, keeps its bookings in a spreadsheet: 286 rows, 20 columns, and every defect a messy export can carry. The Hotel Director has six groups of business questions: which rooms earn the most, which payment methods lead, where revenue leaks, and whether guests are happy.
This project loads the file into PostgreSQL, repairs every defect with plain SQL, answers each question with a query, and presents the answers as a three-page Power BI dashboard. Two long-form articles explain both halves.
Problem
The spreadsheet can't answer the Director's questions because it can't be trusted:
- A duplicate booking inflates stays and revenue.
- Inconsistent category values ("M-PESA", "mpesa", "M-Pesa") split single payment methods into fragments.
- Nulls and invalid entries quietly bias any pivot table built on top.
- Nothing ties a dashboard number back to the rule that produced it, so every figure is arguable.
Fixing the data in Excel by hand would work once and rot immediately. The cleaning had to be code: rerunnable, auditable, and ordered.
Approach & Architecture
Script 01: audit and repair. The CSV lands in a staging table untouched (the raw file is never edited). A second pass audits the damage, then repairs it with plain SQL: regular expressions for pattern fixes, CASE and NULLIF/COALESCE for category standardization and null handling, ctid de-duplication for the exact duplicate, window functions (LAG, RANK, SUM() OVER) for ordered analysis, and FILTER clauses for conditional aggregates. The output is a typed clean table plus a reporting view that the dashboard reads directly.
Script 02: the questions. One query (or a few) per business question, each headed Q1 to Q6 to match the Director's brief. Nothing in the dashboard computes what a query hasn't already answered.
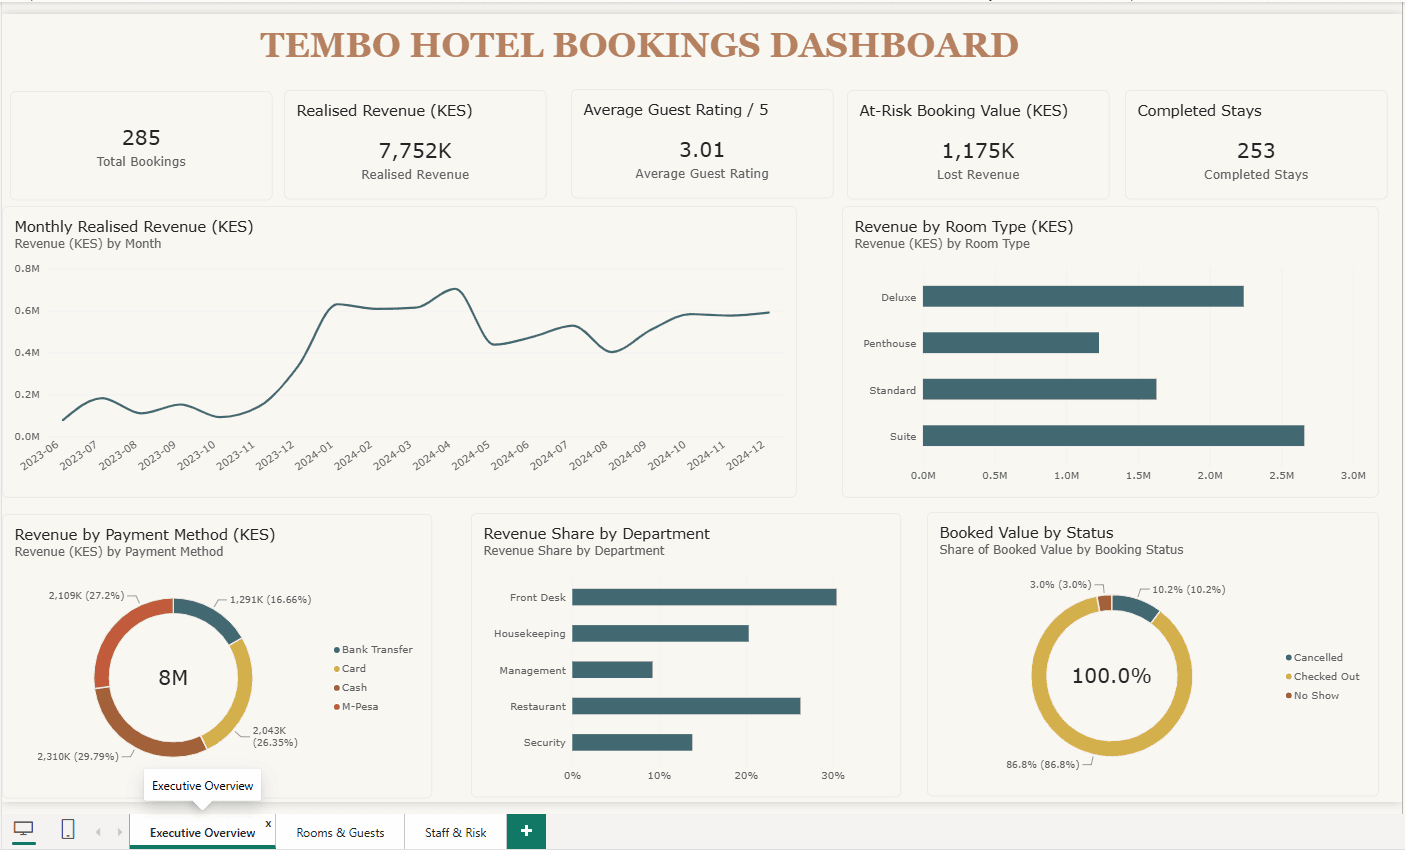
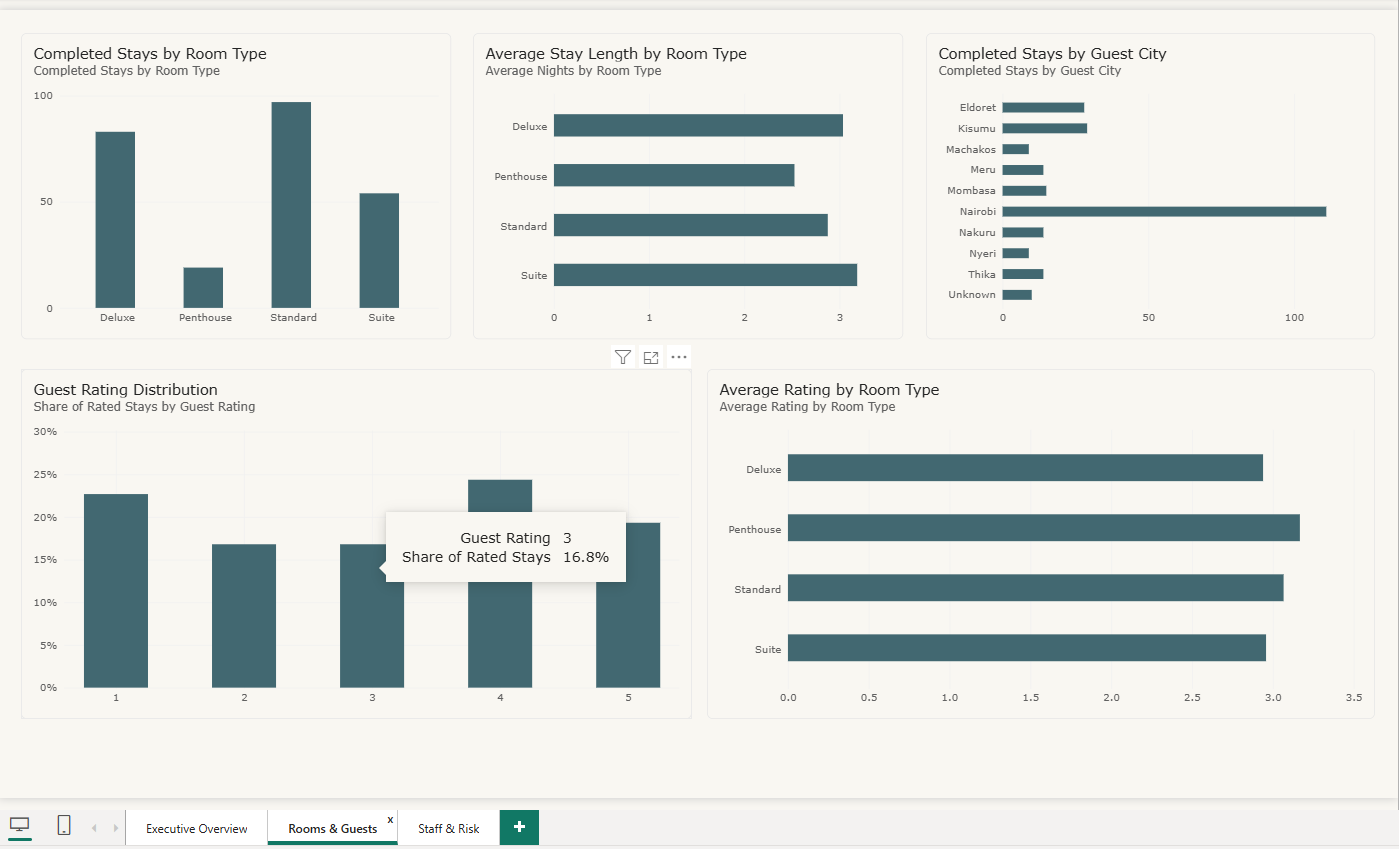
The dashboard. Three pages (Executive Overview, Rooms & Guests, Staff & Risk) with 19 visuals driven by 25 documented DAX measures (CALCULATE, DIVIDE, RANKX, REMOVEFILTERS), each measure written up with its format and where it's used.
Stack
- PostgreSQL 16 (staging tables, views, constraints), SQL only, with no external cleaning tools
- Power BI Desktop as a
.pbipproject: report pages and semantic model in version control - DBeaver as the SQL client; numbered scripts because order matters
Results
Counting only bookings with status Checked Out, from 285 clean bookings spanning June 2023 to December 2024:
| Question | Answer |
|---|---|
| Which room type earns the most? | Suites at 2,659,600 KES, 34.3% of revenue from 54 stays |
| Which room type is booked most? | Standard: 97 stays, but only 21.0% of revenue |
| Which payment method leads? | Cash: 29.8%, with M-Pesa (27.2%) and card (26.4%) close behind |
| Best month in 2024 | April 2024: 704,500 KES |
| Booked value that never arrived? | 1,175,300 KES (~13.2%) across 32 cancellations and no-shows |
| Which room type loses the most bookings? | Penthouse: ~24% cancelled or no-show |
| Are guests happy? | Split: 39.5% of ratings are a 1 or 2, and 43.7% are a 4 or 5 |
The finding that most needs follow-up is deliberately stated as an open question, not a conclusion: all 32 lost bookings were paid by bank transfer, but staff and payment method move together in this file (two people handle bank transfers), so the data cannot say whether the payment method or the recording behavior of two colleagues is the cause. Both articles explain the limit.
Every headline number ties to a SQL query and to the dashboard, and the two reconcile to the shilling: realised revenue 7,752,400 KES, lost revenue 1,175,300 KES, verified in both SQL and DAX.